USDA data show grocery prices going up 2026 in uneven waves
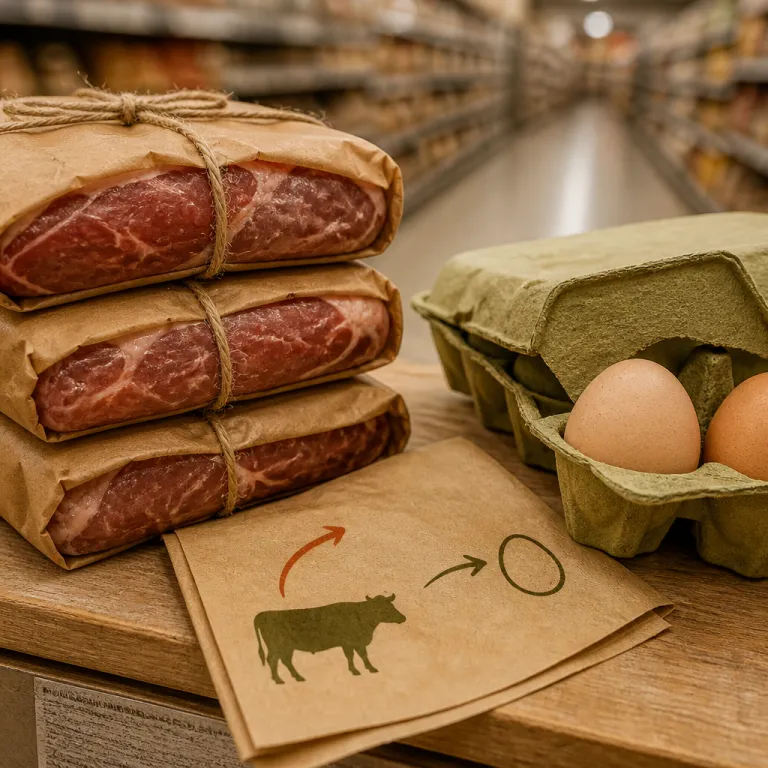
USDA food price outlook data for mid 2026 confirm that supermarket grocery prices are rising in sharply different ways across aisles. While overall food inflation for “food at home” looks moderate, the detailed numbers show beef and veal prices up 12.9 percent year over year and fresh vegetables up 11.9 percent, even as egg prices dropped 35.2 percent and created rare relief for consumers. For a budget conscious household that tracks every euro or dollar of price changes each month, the real story is not a single consumer price index but the widening gap between categories and the new substitution options that this gap creates.
What the latest USDA numbers say about 2026 grocery inflation
When you scan the meat case in grocery stores, the prices paid for beef now sit at the top of the protein ladder while poultry costs have risen only about 1.3 percent and eggs have become the cheapest protein source per gram of food. That means the same family that once built weekly menus around minced beef will now find better value by shifting some meals toward egg based dishes, chicken thighs, or plant proteins, because the consumer price of beef has outrun wages in many regions. USDA’s updated 2026 forecast for the full year, published in its monthly Food Price Outlook tables, shows food at home prices rising about 2.8 percent, yet beef could reach a worst case increase above 12 percent, so the gap between headline inflation and what you actually paid for specific items will keep widening.
Three step plan: track, compare, and swap
For shoppers trying to understand mid 2026 grocery trends, the key is to translate national data into a monthly cart strategy that fits your own stores and digital tools. First, track prices: use price tracking apps, loyalty program histories, or simple spreadsheets to log prices paid for ten to fifteen staple items each month. Second, compare: line up your own data with the official consumer price index for food to see where your personal inflation is highest. Third, swap: if your numbers show beef, fresh vegetables, sugar, and nonalcoholic beverages rising faster than the national average, you will know exactly which aisles to treat as danger zones and which items to buy only on promotion or in smaller quantities.
- Beef and veal: +12.9% year over year (USDA Food Price Outlook, 2026)
- Fresh vegetables: +11.9% year over year
- Eggs: −35.2% year over year
- Poultry: about +1.3% year over year
- Overall food at home: about +2.8% for the year
According to USDA food price outlook reports for 2026, these category level shifts explain why some carts feel far more expensive than the headline inflation rate suggests, even when the official consumer price index for food appears relatively stable.
Holiday cookouts, monthly timing, and where grocery prices still bend
The American Farm Bureau Federation’s 2026 Fourth of July marketbasket survey reports that a holiday cookout for ten people cost 73.82 dollars this year, about 4 percent more than the previous year, which is another concrete sign of food prices rising unevenly for many families. Within that single meal, the price of ground beef rose 5.5 percent, strawberries jumped 12.4 percent, and hamburger buns climbed 7.7 percent, while the costs of potato salad ingredients fell 17.8 percent and quietly reminded consumers that not every food item is inflating at the same rate. For a parent planning several summer gatherings each month, those data points show why you should rebalance menus toward the categories that are falling or flat and away from the items whose prices paid are sprinting ahead.
How to time your cart by month and by store
Timing also matters because mid 2026 food inflation does not move in a straight line from month to month, and seasonal gluts can briefly push the consumer price of some fresh items down even in a high inflation year. A practical way to use this pattern is to build a simple calendar of what to buy in July and what to skip in other months, then match that calendar against local promotions in your preferred grocery stores. For example, you might find strawberries at 2.49 dollars per pound in one neighborhood store in July but closer to 4 dollars in September, while frozen vegetables in the same freezer case barely move in price all year.
Digital tools, Google data, and your privacy policy tradeoff
Digital tools can sharpen this timing strategy, but you should treat every app and loyalty program as both a savings channel and a data trade, because your browsing history, location, and items scanned become part of the digital profile that retailers and advertising platforms such as Google use to target offers. Before you click accept on any new grocery app, read the privacy policy carefully to understand how your consumer data will be stored, how long it will be kept, and whether it will be shared with third parties in ways that could raise your long term costs. If a service offers a small monthly discount but requires extensive tracking of every food purchase, you will need to decide whether the prices you paid at the register truly offset the hidden costs of reduced privacy and more aggressive digital marketing.
Protein swaps, aisle rebalancing, and a practical grocery savings map
With grocery prices in 2026 moving in such uneven patterns, the most powerful savings move is a deliberate protein substitution plan that treats eggs as the new baseline. Because egg prices have fallen more than 35 percent while beef prices have climbed nearly 13 percent, a family that replaces two beef based dinners each week with egg or poultry based meals can cut monthly food costs without shrinking total protein intake. If a typical beef dinner for four costs around 14 dollars at current prices and an egg based meal using a dozen eggs, vegetables, and pantry items costs about 6 dollars, swapping two such dinners per week saves roughly 64 dollars per month, or more than 750 dollars per year in prices paid at the grocery store.
Sample substitution math and aisle by aisle rebalancing
The next layer of your grocery savings map is aisle by aisle rebalancing, where you lean into categories with slower inflation and pull back from the worst offenders, then use store brands to close the gap when quality is comparable. For beverages, nonalcoholic drink prices have risen about 5.8 percent, so switching some purchases from branded sodas to filtered tap water, generic seltzer, or carefully chosen cheap wine brands for adult occasions can keep the overall consumer price of your cart in check. In a practical local example, if a two liter bottle of branded soda in your store costs 2.29 dollars while the store brand sits at 1.19 dollars, replacing four bottles per month trims more than 50 dollars per year from your grocery budget without changing how often you host friends.
Families juggling groceries with other daily needs will also benefit from planning around life events, because rising supermarket prices in 2026 intersect with celebrations, school calendars, and caregiving responsibilities. If you are hosting a baby shower or birthday, for example, you can shift more of the budget toward eggs, poultry, seasonal vegetables, and store brand snacks while using a guide to plan a beautiful baby shower on a budget to keep décor and extras under control. In every case, the method is the same: track your own data on prices paid, compare it with official inflation reports, use digital tools whose privacy policy you accept, and then adjust your cart so that each month you will find more room in the budget even when headline grocery prices are still rising.